You are here: Foswiki>Andypublic Web>DataVisualisationUsingHeatmaps>BirminghamCouncilElections2007 (14 Mar 2008, andyp)Edit Attach
Birmingham Council Elections 2007
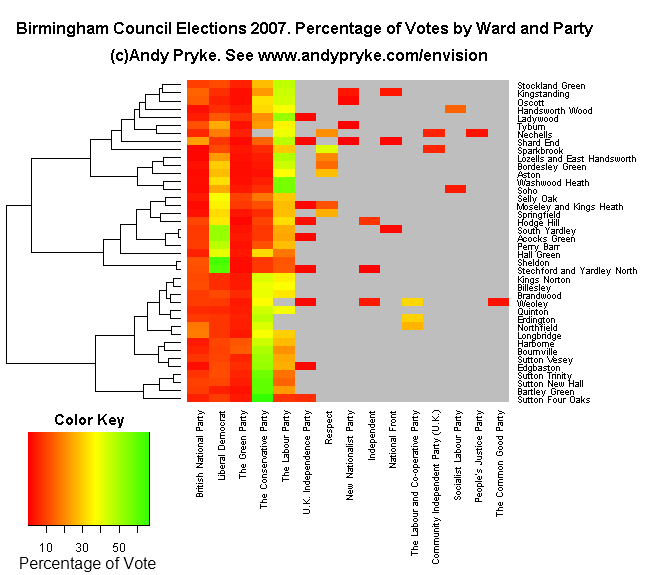
The picture below shows the percentage of votes obtained by each party in each ward. Red indicates a low vote, green the highest. A clear clustering of wards is visible, with the lower half of the diagram dominated by wards with a high Tory vote, the centre by Lib-Dem (mainly with Labour in second place) and the top by Labour wins. If you know the geography of Birmingham, you'll notice that some of the wards which vote similarly are close together (as we might expect), for example, note the four "Sutton..." wards listed at the bottom right. The data was drawn from the Birmingham City Council website, and is believed to be correct, but I have not gone through and hand-checked every result. You can download the election results data file (csv) if you'd like.
Party's Eye View
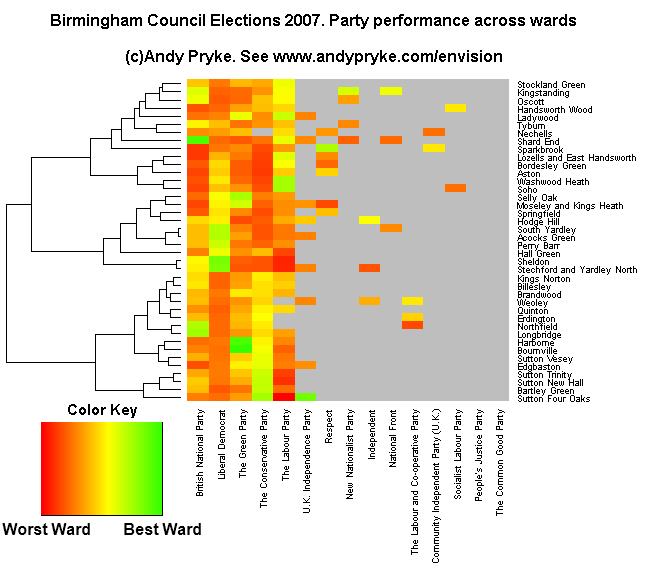
The diagram below has been adjusted to show more detail on the performance of individual parties. The colours indicate the best and worst performing wards for a party. For example, Harbourne and Bourneville are the wards in which the Green Party got their highest percentage, and are shown as green. However, these wards were actually won by the Conservative Party, where the yellow rectangles indicate they are in the middle of that party's list of wards by votes obtained.
Reproduction Rights
You're welcome to reproduce this image as long as it remains completely unchanged. This includes reproducing the title and url "www.andypryke.com/envision" at the top of the picture. I'd be grateful if you would provide a link to that URL and email me to let me know if you've reproduced it or found the diagram useful. Thanks, AndyEdit | Attach | Print version | History: r2 < r1 | Backlinks | View wiki text | Edit wiki text | More topic actions
Topic revision: r2 - 14 Mar 2008, andyp
Favourite Pages
My Blog
Best Of Blog 2007
Best Of Blog 2005 Birmingham,
How to be Happy,
Influenza Pandemic,
Moseley Tornado,
Misty's Big Adventure,
Street Furniture Stickers,
Weird Internet Animations
Other People's Blogs
Birmingham Bloggers Danger! High Postage,
Parallax View,
Pete Ashton,
Silent Words Speak Loudest
Please don't ask for a sidebar link as a refusal often offends. Editorial Policy
 Copyright © by the contributing authors. All material on this collaboration platform is the property of the contributing authors.
 Ideas, requests, problems regarding Foswiki? Send feedback
